
/Teaching/Operating Systems/Tutorials/Debugging SWEB with GDB Lock Tree
Debugging SWEB with GDB Lock Tree
You should read the SWEB debugging tutorial before reading this tutorial on using (C)GDB with Thomas Malcher’s Lock Tree.
What it does
This is a little extension of gdb that records all function calls to Locks.
It is able to:
-
build a graph of the locks a thread uses
-
summarize and print information about the caller of each Lock
-
check if there is possibly a deadlock
-
print all locks that are currently held by a thread
How it works
This tool uses the python API of gdb which is very powerful to analyze programs at runtime and script gdb . It creates breakpoints for acquiring and releasing a Lock (e.g. Mutex::acquire and Mutex::release). If one of these breakpoints gets hit during sweb execution the python code reads out the currentThread, the address of the Mutex object and its name_ attribute, the calling function etc. Then it continues the execution of sweb. For each thread it stores the recorded information in a graph called locktree.
So the program needs to run for a while so that the tool can record information about the locking behaviour of sweb.
What is a Locktree
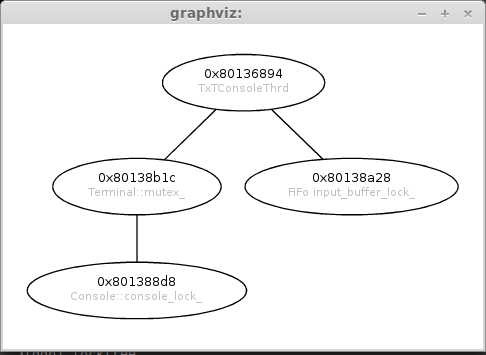
A locktree is a graph representation of the locking behaviour of a thread. See the example on the right side. The root node of the tree specifies the thread, so in this case we are looking at the locking behaviour of a thread with name TxTConsoleThrd which is located at address 0x80136894 in SWEB.
All nodes below the root node represent Locks. The structure of the tree represents the locking order of the thread. In case of TxTConsoleThrd for instance it first acquires the lock at address 0x80138b1c with the name_ attribute Terminal::mutex_ and afterwards the Lock with name Console::console_lock_. Release happens in the reverse order. Over all TxTConsoleThrd used three locks while we monitored it.
Requirements and Installation
gdb with python3 support
→ gdb7 or later should work (tested with 7.7)
check python support and version by entering python print(sys.version)should print version 3.x
(gdb) python print(sys.version)
3.4.0 (default, Apr 11 2014, 13:08:40)
[GCC 4.8.2]
The graphviz library is used for an appealing graphical output of locktrees
Installation
-
clone repository
-
add following lines to
SWEBROOT/utils/gdbinit
python sys.path.append('/PATH/TO/gdbLockTree/REPOSITORY/')
import LockTreeCommand end
-
start
gdbfrom the commandline -
now there should be a command locktree with some subcommands
(gdb) locktree
useless
holdlocks
stop
printthreads
printgui
.....
The git repository can be found here: https://github.com/tmalch/gdbLockTree
Limitations
+ it doesn’t influence the timing of SWEB (if a breakpoint gets hit the virtual processor stops)
– it is slow because qemu stops execution of SWEB for each acquire/release
Commands
For most commands there exists a completion
-
locktree plugins: prints name of all available plugins for different locks (eg Qt Mutex, SWEB Mutex)
-
locktree monitore <pluginName>: creates Breakpoints for the given plugin
-
locktree stop: deletes all Breakpoints created by the locktree command
-
locktree useless: shows all locks that are only used by one thread (are possibly useless)
-
locktree check: executes locktree algorithm to detect possible deadlocks and reports result
-
locktree printthreads: prints the recorded threads
-
locktree printgui <threadid>: opens a window with a graph view of the locktree of the given thread (needs graphviz)
-
locktree printtree <threadid>: prints the locktree of the given thread as ascii art
(gdb)
  |--0x80136894 -- (TxTConsoleThrd)
  | |--0x80138b1c -- (Terminal::mutex_)
  | | |--0x801388d8 -- (Console::console_lock_)
  | |--0x80138a28 -- (FiFo input_buffer_lock_)
-
locktree holdlocks <threadid>: prints the locks currently held by the given thread
-
locktree lockinfo <lockid>: prints information about the given lock.
graphviz representation
Where is it defined which threads use it and from where in the code is it called
(gdb) locktree lockinfo 0x80138b1c
0x80138b1c -- (Terminal::mutex_)
2 Thread call this lock
Thread 0x80136894 -- (TxTConsoleThrd) called the lock from
MutexLock::~MutexLock() at ...kernel/MutexLock.cpp:38
 Terminal::write(char) at ...console/Terminal.cpp:154
  TextConsole::Run() at ...sole/TextConsole.cpp:110
MutexLock::MutexLock(Mutex&) at ...kernel/MutexLock.cpp:11
 Terminal::write(char) at ...console/Terminal.cpp:151
  TextConsole::Run() at ...sole/TextConsole.cpp:110
---------------------------------------------
 Thread 0x8014d234 -- (/stdin-test.sweb) called the lock from
MutexLock::~MutexLock() at ...kernel/MutexLock.cpp:38
 Terminal::write(char) at ...console/Terminal.cpp:154
  oh_writeCharWithSleep(char) at .../console/kprintf.cpp:21
MutexLock::MutexLock(Mutex&) at ...kernel/MutexLock.cpp:11
 Terminal::write(char) at ...console/Terminal.cpp:151
  oh_writeCharWithSleep(char) at .../console/kprintf.cpp:21
---------------------------------------------
Use Cases
-
locktree monitore swebMutex
-
continue
-
after some time press Ctrl-C to pause excecution
-
now you can look at the recorded locktrees, check them for possible deadlocks and so on
Which Locks does thread XY hold at a certain location in code?
-
set a breakpoint at the location
-
locktree monitore swebMutex
-
run sweb
-
when the breakpoint gets hit
-
execute: locktree holdlocks XY
Bugs
I’m sure there are quite some so please send bug reports to malcher@student…
Also new ideas for commands are welcomed!